Automate Microservice Performance Testing with Hoverfly Cloud
Running performance testing in an automated CI (Continuous Integration) pipeline allows a team to evaluate the performance impact of code change early and continuously. However, testing one service for a Microservice project typically requires several other external APIs to be up and running. Maintaining a separate testing environment can be expensive. You may also have service dependencies that are not yet developed, or not always available or have changing data that result in flaky tests.
We face the same challenges at SpectoLabs, and we found that Service Virtualization is an elegant solution for Microservice testing that requires system integration, such as performance testing or UI functional testing. Service Virtualization is a technique to simulate external dependencies and isolate the SUT (System Under Test) so that the test can be easier to set up, run faster and more reliable. In this blog, we will demonstrate how to set up a performance test using Hoverfly Cloud in the CI pipeline.
What tools are we using
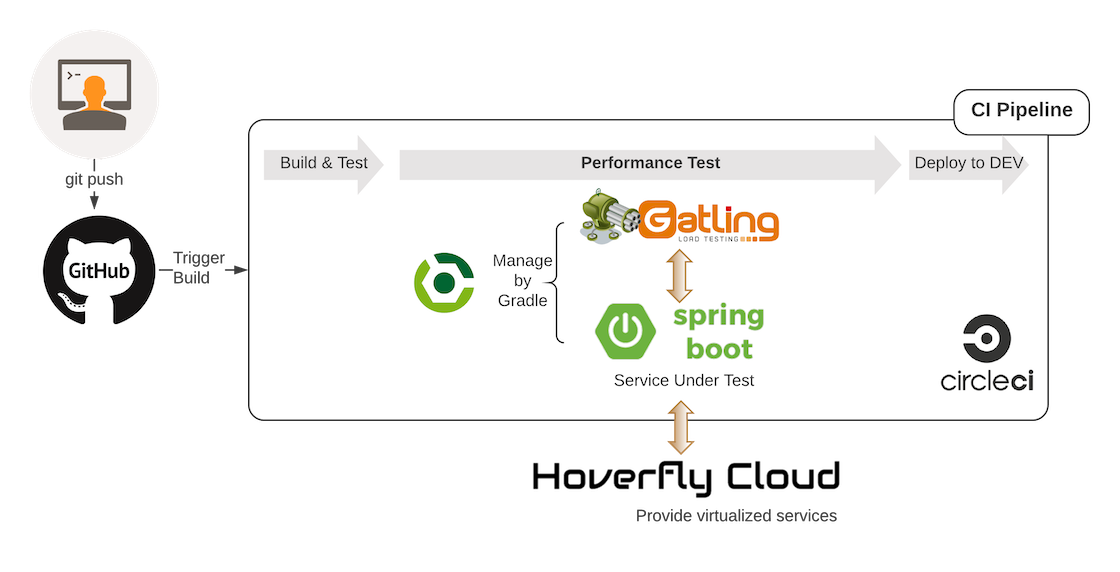
We use the following tools to set up an automated performance testing pipeline described in the above diagram:
Gatling for building the performance test script
Gradle for automating the test execution
Hoverfly Cloud for virtualizing any service dependencies
CircleCI for running the build pipelines
We use Gatling as our performance testing tool because it is easy to script and has good documentation. JMeter is also a very popular alternative. You can see a comparison of both tools.
Hoverfly Cloud is a high-performance SV (Service Virtualization) platform and is a publically available SaaS product at https://cloud.hoverfly.io. It is also available as a fully-managed service on AWS via PrivateLink. Hoverfly Cloud is built on Kubernetes and designed to be highly scalable for meeting any load testing demand and unlimited numbers of users. Our tests have proven that one Hoverfly service, without clustering, can handle up to 5000 Requests Per Second (RPS) using a standard VM with 1 vCPU on Google Cloud Platform.
“Drinking Our Own Champagne”
We will use one of our performance tests for Hoverfly Cloud as a real-life example. The SUT is the Github Login API on our Authentication Service. Our objective is to understand the response time of the API for a new user sign up, and whether it can handle the expected load.
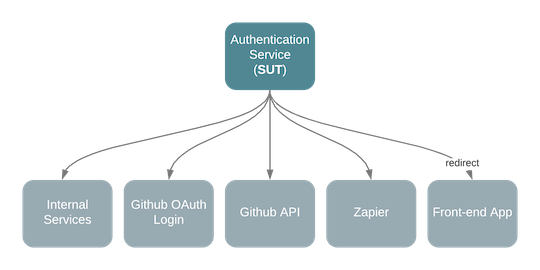
The Authentication Service has interactions with several endpoints when a user hits the Github Login API. It involves negotiating with the Github OAuth service and APIs, with another internal service, and with Zapier in order to automate other post sign up workflows. This can be illustrated in the following diagram.
Setting up a performance test on this API would seem a bit overwhelming. Firstly the user details returned from Github must be different each time, so that the service would invoke the new user sign up logic. This is simply unrealistic. We will be spamming Github with lots of fake user accounts, even though for service that provides a sandbox environment, setting up and tearing down test users is a tedious task.
The second challenge is that we need to run an internal service which in turn may have other dependencies and so on. If the performance test is failed or interrupted, cleaning the aftermath of a failed test could be a nightmare.
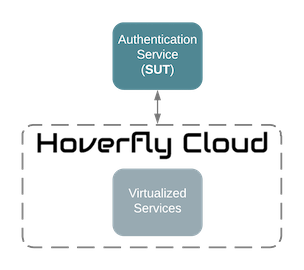
Service virtualization is a good answer to these problems. It creates an entire virtualized environment the SUT depends on which can be stateless, therefore no need to clean up data when a test failed half way. It’s deterministic and behaves as exactly as it should be based on a simulation file.
Automate Gatling with Gradle
The first step is to create an automated performance test plan. There is a very comprehensive tutorial on this topic.
Here is an outline of the steps you need to take:
Create a Gatling test scenario
Create a Gradle task to start the Gatling test
Create a Gradle task to automatically run and stop the Spring Boot service before and after the test.
Create a Gatling test scenario
Here is a very simple test plan created with Gatling API and written in Scala.
It simulates 10 concurrent users hitting the Github Login API (http://localhost:8080/authentication/login/github/authorised), with a ramp-up time over 10s. It will run for 20s and the test will assert that all the requests are successful.
package io.specto.authentication.gatling.simulation
import io.gatling.http.Predef._
import io.gatling.core.Predef._
import scala.concurrent.duration._
import scala.util.Random

class UserLoginSimulation extends Simulation {

 val rampUpTimeSecs = 10
 val testTimeSecs = 20
 val noOfUsers = 10
 val minWaitMs = 1000 milliseconds
 val maxWaitMs = 3000 milliseconds

 val baseURL = "http://localhost:8080"
 val baseName = "user-login"
 val requestName = baseName + "-request"
 val scenarioName = baseName + "-scenario"
 val URI = "/authentication/login/github/authorised"

 val httpConf = http
   .baseURL(baseURL)
   .acceptHeader("text/html,application/xhtml+xml,application/xml;q=0.9,*/*;q=0.8") // 6
   .doNotTrackHeader("1")
   .acceptLanguageHeader("en-US,en;q=0.5")
   .acceptEncodingHeader("gzip, deflate")
   .userAgentHeader("Mozilla/5.0 (Windows NT 5.1; rv:31.0) Gecko/20100101 Firefox/31.0")

 val scn = scenario(scenarioName)
   .during(testTimeSecs) {
     exec(
       http(requestName)
         .get(URI)
         .queryParam("code", "some-code")
         .queryParam("state", "some-state-token")
         .check(status.is(200))
     ).pause(minWaitMs, maxWaitMs)
   }

 setUp(
   scn.inject(rampUsers(noOfUsers) over (rampUpTimeSecs))
 ).protocols(httpConf).assertions(global.successfulRequests.percent.is(100))
}
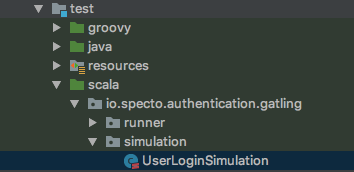
We have the above folder structure, where UserLoginSimulation is under the test/scala folder, so that the Gradle Scala plugin would be able to find and compile it later on.
Create a Gradle task to start the Gatling test
Create the following task in the build.gradle file.
task testPerf(type: JavaExec) {
   description = 'Test the Spring Boot web service performance with Gatling'
   group = 'Performance Test'
   classpath = sourceSets.test.runtimeClasspath
   jvmArgs = [
           // workaround for https://github.com/gatling/gatling/issues/2689
           "-Dgatling.core.directory.binaries=${sourceSets.test.output.classesDir.toString()}"
   ]
   main = 'io.gatling.app.Gatling'
   args = [
           '--simulation', 'io.specto.authentication.gatling.simulation.UserLoginSimulation',
           '--results-folder', "${buildDir}/reports",
           '--binaries-folder', sourceSets.test.output.classesDir.toString() // ignored because of above bug
   ]
}
We also add Scala plugin to compile Scala code.
plugins {
   id 'scala'
}
We need to add Gatling Highchart dependency in order to generate the graphical report after each test.
dependencies {
   testCompile 'io.gatling.highcharts:gatling-charts-highcharts:2.3.0'
}
Automatically run and stop the Spring Boot service
To run this test, the SUT should be running as well. You may be able to do that manually when you are doing local development, but automation is needed for the CI pipeline.
The original blog suggests creating a customized script for starting and stopping the application, but we have found a simpler and cleaner approach to tackle this problem using an underrated Gradle plugin https://github.com/psxpaul/gradle-execfork-plugin
It allows us to run the Spring Boot service in the background, and provide a simple interface to start and stop it.
Firstly include the library to your plugins.
plugins {
   id 'com.github.psxpaul.execfork' version '0.1.8'
}
Then create a Gradle task of type JavaExecFork.
task startSpringBoot(type: com.github.psxpaul.task.JavaExecFork) {
   classpath = sourceSets.main.runtimeClasspath
   main = 'io.specto.authentication.Bootstrap'
   jvmArgs = [ '-Dspring.profiles.active=gatling' ]
   stopAfter = testPerf
   waitForPort = 8080
   waitForOutput = 'Started Bootstrap in '
}

startSpringBoot.dependsOn assemble
testPerf.dependsOn startSpringBoot
Here we are telling the plugin where the main class is, that it should use the gatling Spring application profile and that it should stop after the testPerf task.
It also blocks the execution of testPerf task until the Spring Boot application is up and running by meeting two conditions:
The application port is open, and
The application has printed out the message “Started Bootstrap in x seconds” which is a typical readiness indication of a Spring Boot app.
However, this is just a hack for checking the service is up because the plugin does not support probing the health check endpoint.
Virtualizing the service dependencies
In this section, I will show you how to virtualize the service dependencies using Hoverfly Cloud. You will be able to bring up the virtualized environment for your testing with only one command in your CI configuration.
Creating simulations
Hoverfly simulations are JSON files that contain pairs of HTTP requests and their corresponding HTTP responses. It can faithfully represent the interactions with a real service in the past or can contain logic that generates response data dynamically.
There are different ways of creating the simulations of the external APIs using Hoverfly Cloud.
Capture on the Cloud: this is suitable for third-party API that is available on the public internet, for example, Github API. We simply create a capture service in Hoverfly Cloud.
Capture locally: This is suitable for internal service that is behind your firewall.
Create manually: I used this method when I create a simulation for the OAuth redirect URL, as it simply requires an endpoint that returns 200 response for any request.
Convert from Swagger: this is useful for creating a simulation for your internal service that already documented using Swagger, simply upload the file to Hoverfly Cloud, and it will generate a simulation that can be run as a service.
Simulating thousands of users with response templating
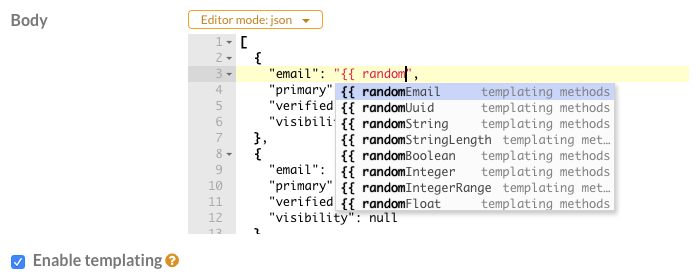
Don’t forget that data creating by capturing or from Swagger is only static, meaning that on every Github user API request, it will return the same user details. This is not quite helpful if we need to create loads that mimic different user logging in each time. Here are some advanced SV features can come into play.
Open up the Simulation Editor, we can replace the static value in the response body with templates, such as using a randomString template function for the username, and a randomEmail template function for the email. That’s all you need to do to simulate API responses that are dynamically change over time. When our SUT processes this OAuth response, it will treat each user as a new user!
Configuring simulations with scenarios
So how do we use these simulations and how do we control them so they will be available serving the requests whenever I need them. You can use a feature in Hoverfly Cloud called Scenario.
A scenario is essentially a collection of services with their configuration data. It is a recipe for Hoverfly Cloud to run these services for your test with particular simulation and the exact behaviour you specified.
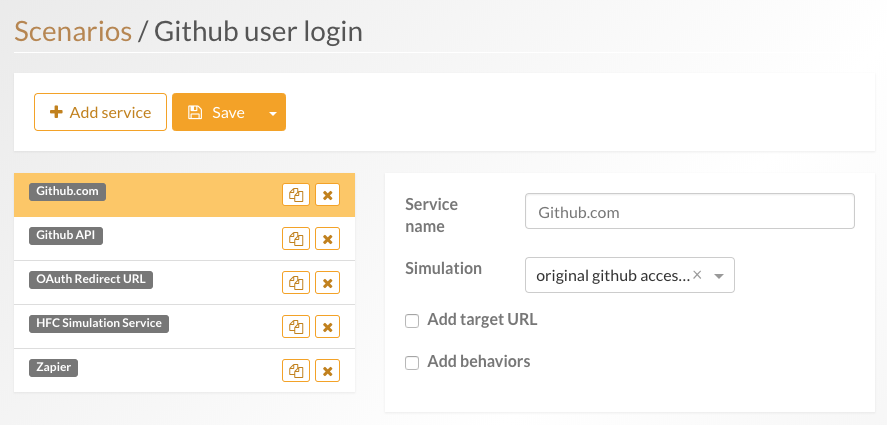
You can create one using the Scenario Editor, and then run it from the Dashboard or using the Hoverfly Cloud CLI which we will need later for configuring the CI job.
Swapping real services with Hoverfly Cloud
Running the scenario will create a public URL for each of the virtualized services. You can simply replace the real service base URL with those from Hoverfly Cloud. For a Spring Boot application, simply create a new profile called gatling, and use it as the active profile.
Adding to the CI pipeline
We are using CircleCI, but the setup for other CI platforms should be similar, as it only requires two setups:
export an environment variable for your Hoverfly Cloud API token which is used by Hoverfly Cloud CLI to authenticate your requests
add a task to your pipeline that starts the scenario, run the Gradle testPerf task, and pause the scenario afterwards.
 steps:
      - run:
          name: Run Gatling Tests
          command: |
            ./hcc version
            ./hcc scenario start --name 'Github user login' --api-token $HFC_TOKEN
            ./gradlew clean testPerf
            ./hcc scenario pause --name 'Github user login' --api-token $HFC_TOKEN
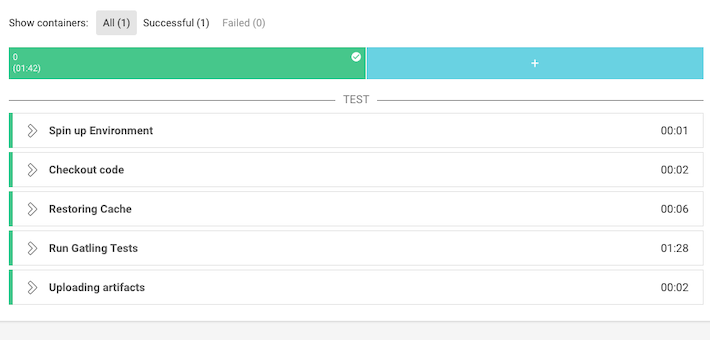
Results
The performance test CI job takes less than two minutes to run. As it is triggered on every commit to master, we can detect any deterioration to performance early and often. It helped us to get around the problem with creating lots of fake user accounts on Github.
Conclusion
The automated performance testing on the CI pipeline is easy to set up with the help of service virtualization because we have avoided the complexity of running additional test infrastructure and creating test data. The Hoverfly services are lightweight and fast to spin up, giving us fast feedback and enabling us to test often and early.
The simulation provides a consistent way to create the virtualized environment for your SUT. It prevents unexpected failure caused by a corrupted state from the previous failed test or the interference due to a shared test environment. You can also take those simulations and run the performance test anywhere you like, on your local development machine, or even testing in production. You can rest assured that your test environment is predictable and repeatable. Although we only talk about performance testing in this blog, Service Virtualization can also benefit other test automation in the CI/CD pipelines.